
In today’s Money Weekend…I actually think the next leg down could surprise many with how far it goes…Frances explains why she loves Retirement Trader…the point of control acts like a magnet…and more…
I’ve given you a crash course in my trading approach over the last few months and now is the time to go to the next step and start analysing markets in real time, so you can see how it works.
Today I’m going to focus on the current setup for gold and explain why I took profits in gold stocks in August when prices were above US$2,000.
My current view on gold is short-term bearish but long-term bullish. So, I expect the current selling pressure to continue and I actually think the next leg down could surprise many with how far it goes.
I’m going to use all of the concepts that I have been teaching you in these ‘Trader’s Corner’ articles. If you have been following along you should have no problems understanding the logic.
If you haven’t been reading my articles and want to scrub up on the theory, you can find my past articles here.
But before I get started I want to let you know that there is a Retirement Trader ‘Magnetic Trading’ workshop that is currently running until tomorrow night, when it will be taken down.
If you want to see for yourself how I have traded with members of Retirement Trader using the theory that I have been showing you, you should check it out.
You will see live trades with explanations of why we entered where we did, where we took part profits, and what the logic was for each stop-loss level being set along the way.
Frances has been a member of Retirement Trader for over two years and she kindly agreed to let people know what her experience has been. Just click on the picture to find out how we went during the crash and how many winners I have been picking for her.
How to Limit Your Risks While Trading Volatile Stocks. Learn more.
Frances explains why she loves Retirement Trader
Only 23% of stock trades have been losers since the service began in late 2018, so if you want to find out why, you should check out the workshop here.
Gold price can fall further
|
|
|
Source: Tradingview.com |
Now let’s have a quick look at the gold price using my method.
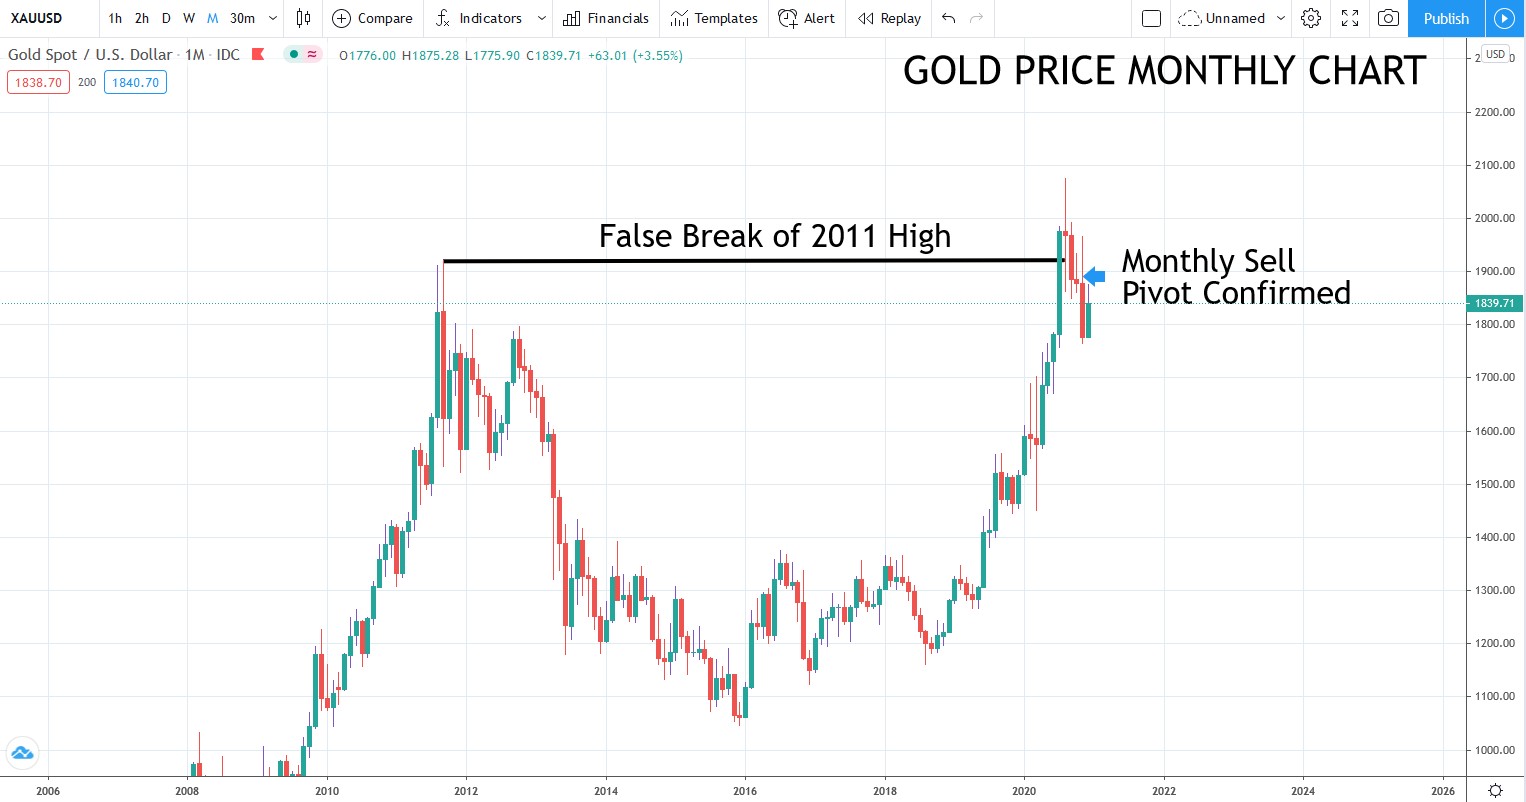
One of the key things I have shown you is that markets have a habit of having false breakouts far more often than breakouts.
Gold is currently having a false break of the 2011 high that remained the all-time high for nine years.
In other words, it’s a really important level. Even if prices are ultimately heading higher (which I think is the case) prices could have a serious false break of that high and shake out many traders who have been buying the strong rally over the past year.
The second thing to point out is that a monthly sell pivot was confirmed last month.
We now have two important pieces of the puzzle taking shape. We know that false breaks often happen at important levels (i.e. that prices have a high probability of changing direction) and we have a monthly confirmation of a change in direction (the monthly sell pivot).
Prices have since rallied up into the guts of the monthly sell pivot candle and are seeing strong resistance near the point of control (midpoint) of last month’s range.
There are many boxes being ticked according to my strategy that says bulls should tread carefully from here.
The weekly trend has been pointing down since early August.
That is the reason why I took a large chunk of profits then out of the four gold stocks that were in the Pivot Trader portfolio.
In the interests of full disclosure here is the alert that I sent on 19 August when the gold price was above US$2,000 (currently US$1,840):
|
|
|
Source: Pivot Trader |
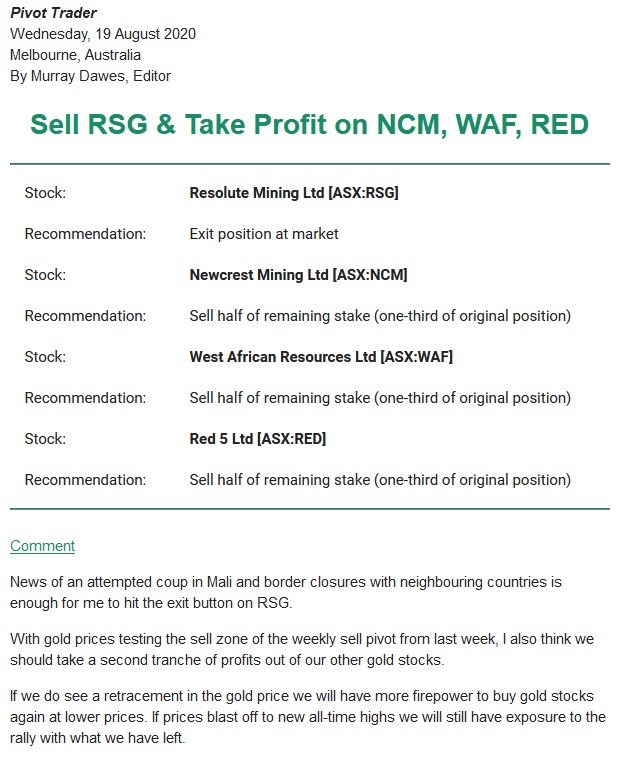
So, the combination of knowing there was a high risk of a false break of a key level plus confirmation of the weekly sell pivot was all I needed to hit the sell button.
The gold price has never traded higher than the price it was on the day when we sold and the gold stocks we took profits on are all trading a lot lower.
Now let’s have a think about where prices could head on a correction.
Here is the monthly gold chart again with the calculation of the point of control of the past decade’s trading:
The point of control acts like a magnet
|
|
|
Source: Tradingview.com |
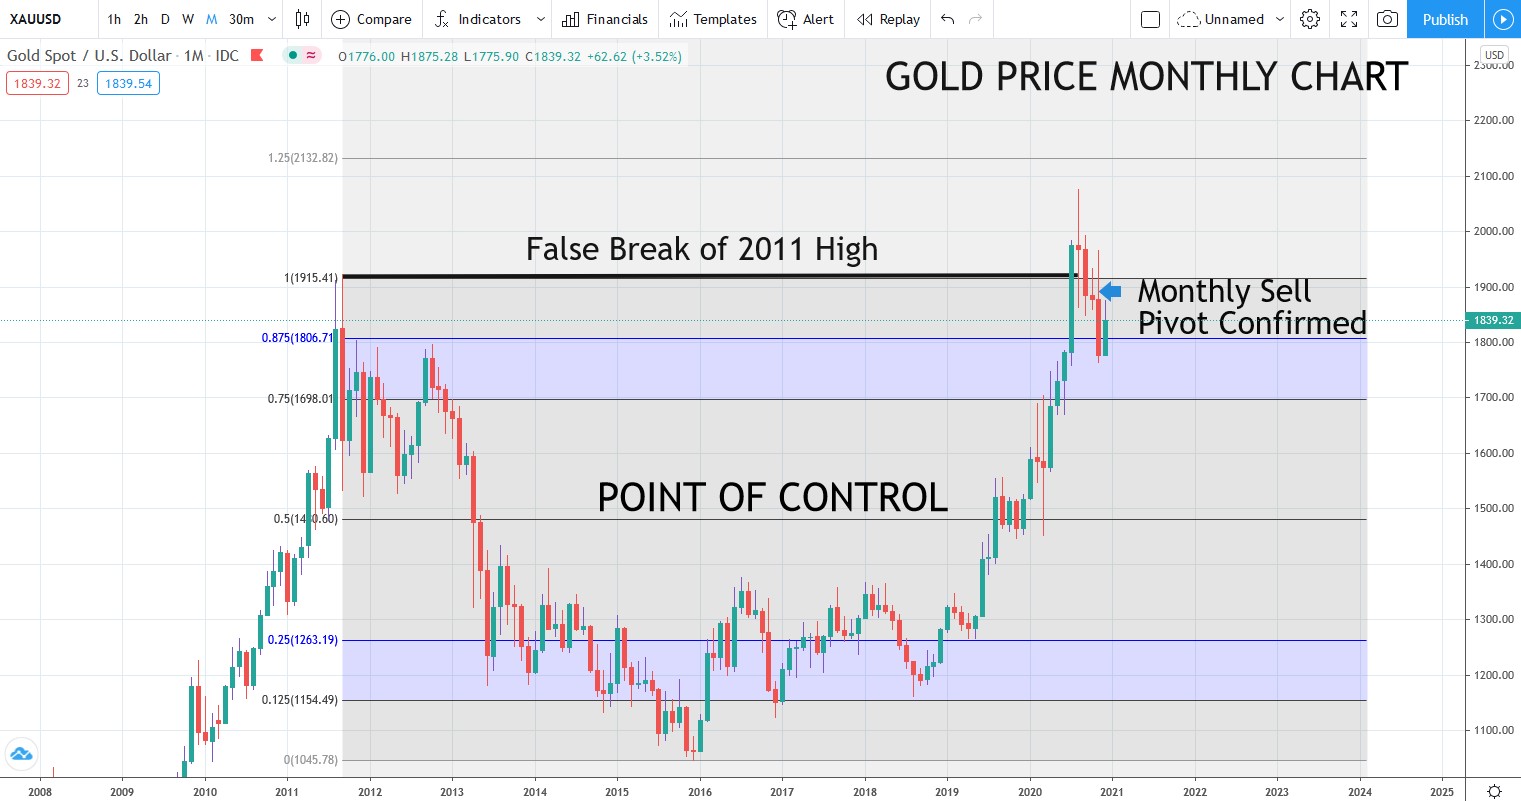
If the correction gathers steam there is the possibility prices could fall all the way to the point of control of the whole range at US$1,500 — which is a long way from the current price of US$1,840.
Many would be surprised by such a move and would be shaken out of positions. But the fact is the long-term chart will remain bullish even if that happens.
US 10-year bond yields are nudging up against 1%, having sold off quite sharply over the past few months. Higher bond yields are negative for the gold price.
The safe haven bid is also waning as we head towards the world getting vaccinated against the virus.
If US Bond yields do spike through 1%, I reckon it will be hard for gold to hold current levels and there is a chance, based on what I showed you today, that it could surprise to the downside.
Regards,
 |
Murray Dawes,
For Money Weekend
PS: Our publication Money Morning is a fantastic place to start on your investment journey. We talk about the big trends driving the most innovative stocks on the ASX. Learn all about it here.